This month I am teaching a data storytelling & vizualization course at IHM Business School here in Malmö, and I was searching for the perfect data analysis resource for my students, something that would push them to think outside the box, and grounded in the reality of modern business.
So, because I couldn’t quite find exactly what I was looking for, I decided to create it myself and share it with everyone, not just my class, for free 🙂
This guide you will read below is the resource I wish I had when I started out, and it’s the way I’d normally approach an analysis task. Of course, there are some secrets, flavors and things I do that I will keep for myself, but at large, this is my process, and I hope it will be useful to you.

But, first, what is really data analysis?
Well, it can mean different things to different people. You could be a data engineer or a data scientist who focuses on cleaning, transforming and modelling data using SQL, Python, etc, to make that data usable, and you all could collectively call what you are doing data analysis.
Then you have the BI crowd, the business intelligence experts who are using the data provided by data engineers and are creating dashboards in Looker Studio, Tableau, Power BI and other data visualization tools.
And finally, you have the Business Analyst. We take data that is already cleaned and prepped for use, this data can already exist in a dashboard, and we interrogate it, we enrich it with context and then we translate it into a strategic narrative that normally covers where we are now (current state), where we can go (the potential or opportunity) and how do we get there (strategic recommendations).
And then, of course, there could be people that do all of those 3 things at once and do it very well. But because I am not one of those people, I am mostly the third, this guide will focus on the business analyst role.
To make this practical and not just theoretical, we’re going to walk through a simple, very “now” use case from start to finish.
We’ll be playing the role of an analyst for a DTC, eco-friendly skincare brand that sells both one-off products and a subscription service. We’ll assume we have dashboards that blend Google Search Console data with behavioral data from a tool like Amplitude, Piwik PRO or GA4. The numbers you will see below are obviously made up.
Now, before we can “analyze” this brand’s data, we have to understand the world it operates in. And that world, as of August 2025, looks very different than it did even a few years ago.
Our skincare brand competes in a world where the user journey is fragmented and AI is reshaping how we find and consume information.
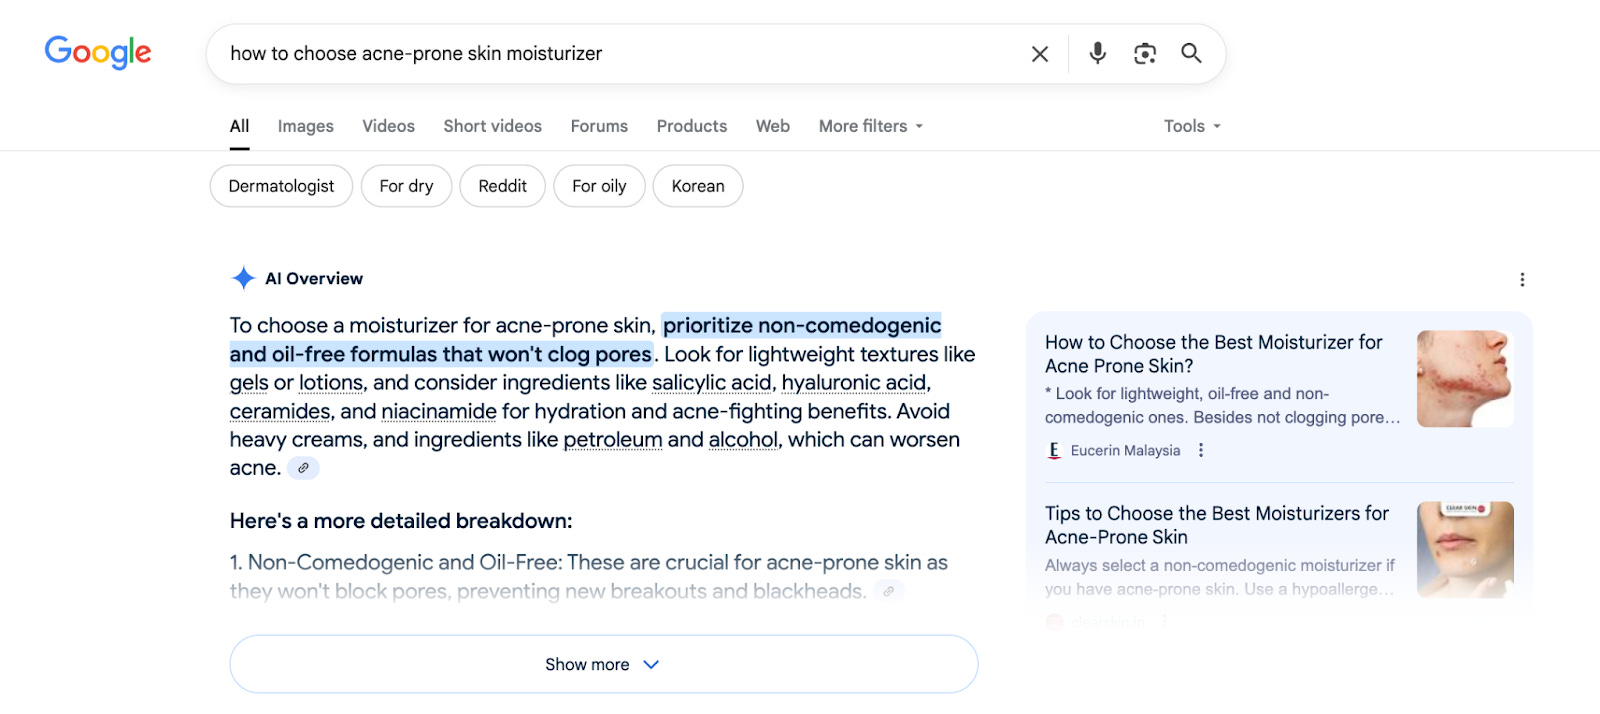
Google’s AI Mode often provides direct answers, synthesizing information from multiple sources. This means users may get their answer without ever clicking on a link. (No, I am not saying this is something good, but it’s what’s going on.. to a degree ;))
Also, the user journey no longer starts just on Google or other search engines. It’s entirely decentralized. It could start with a search on Reddit (“best vitamin c serum for sensitive skin reddit”), a TikTok video from an influencer or a question in a Discord community.
This new reality is not really new from my mediocre SEO POV, it just reinforces something that always mattered: informational, helpful, people first content and brand authority.
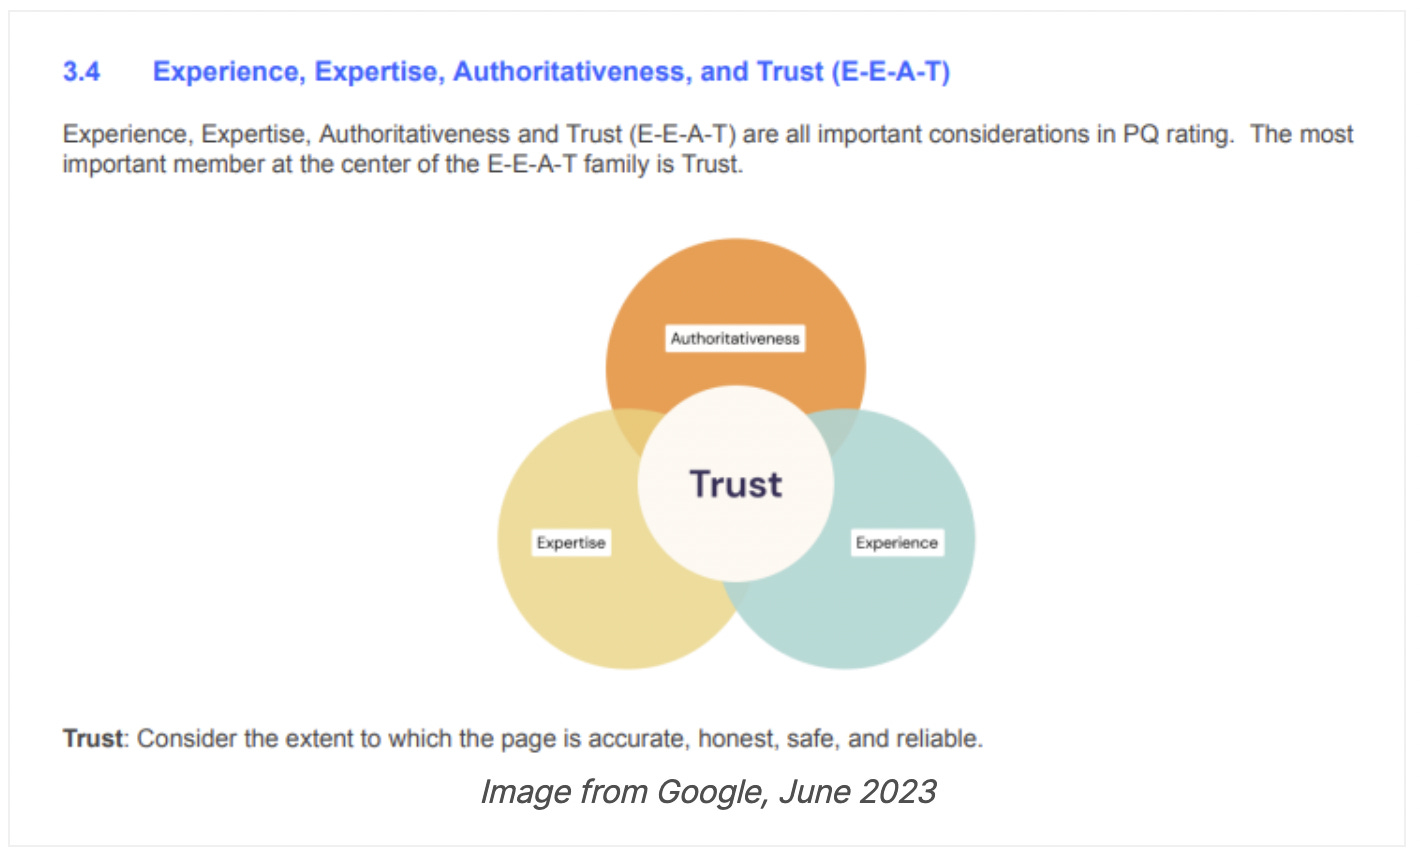
And in this not so new world, you need to become the source. To be featured in AI Mode responses, you must be a highly trusted, authoritative source (E-E-A-T), same as before 😉
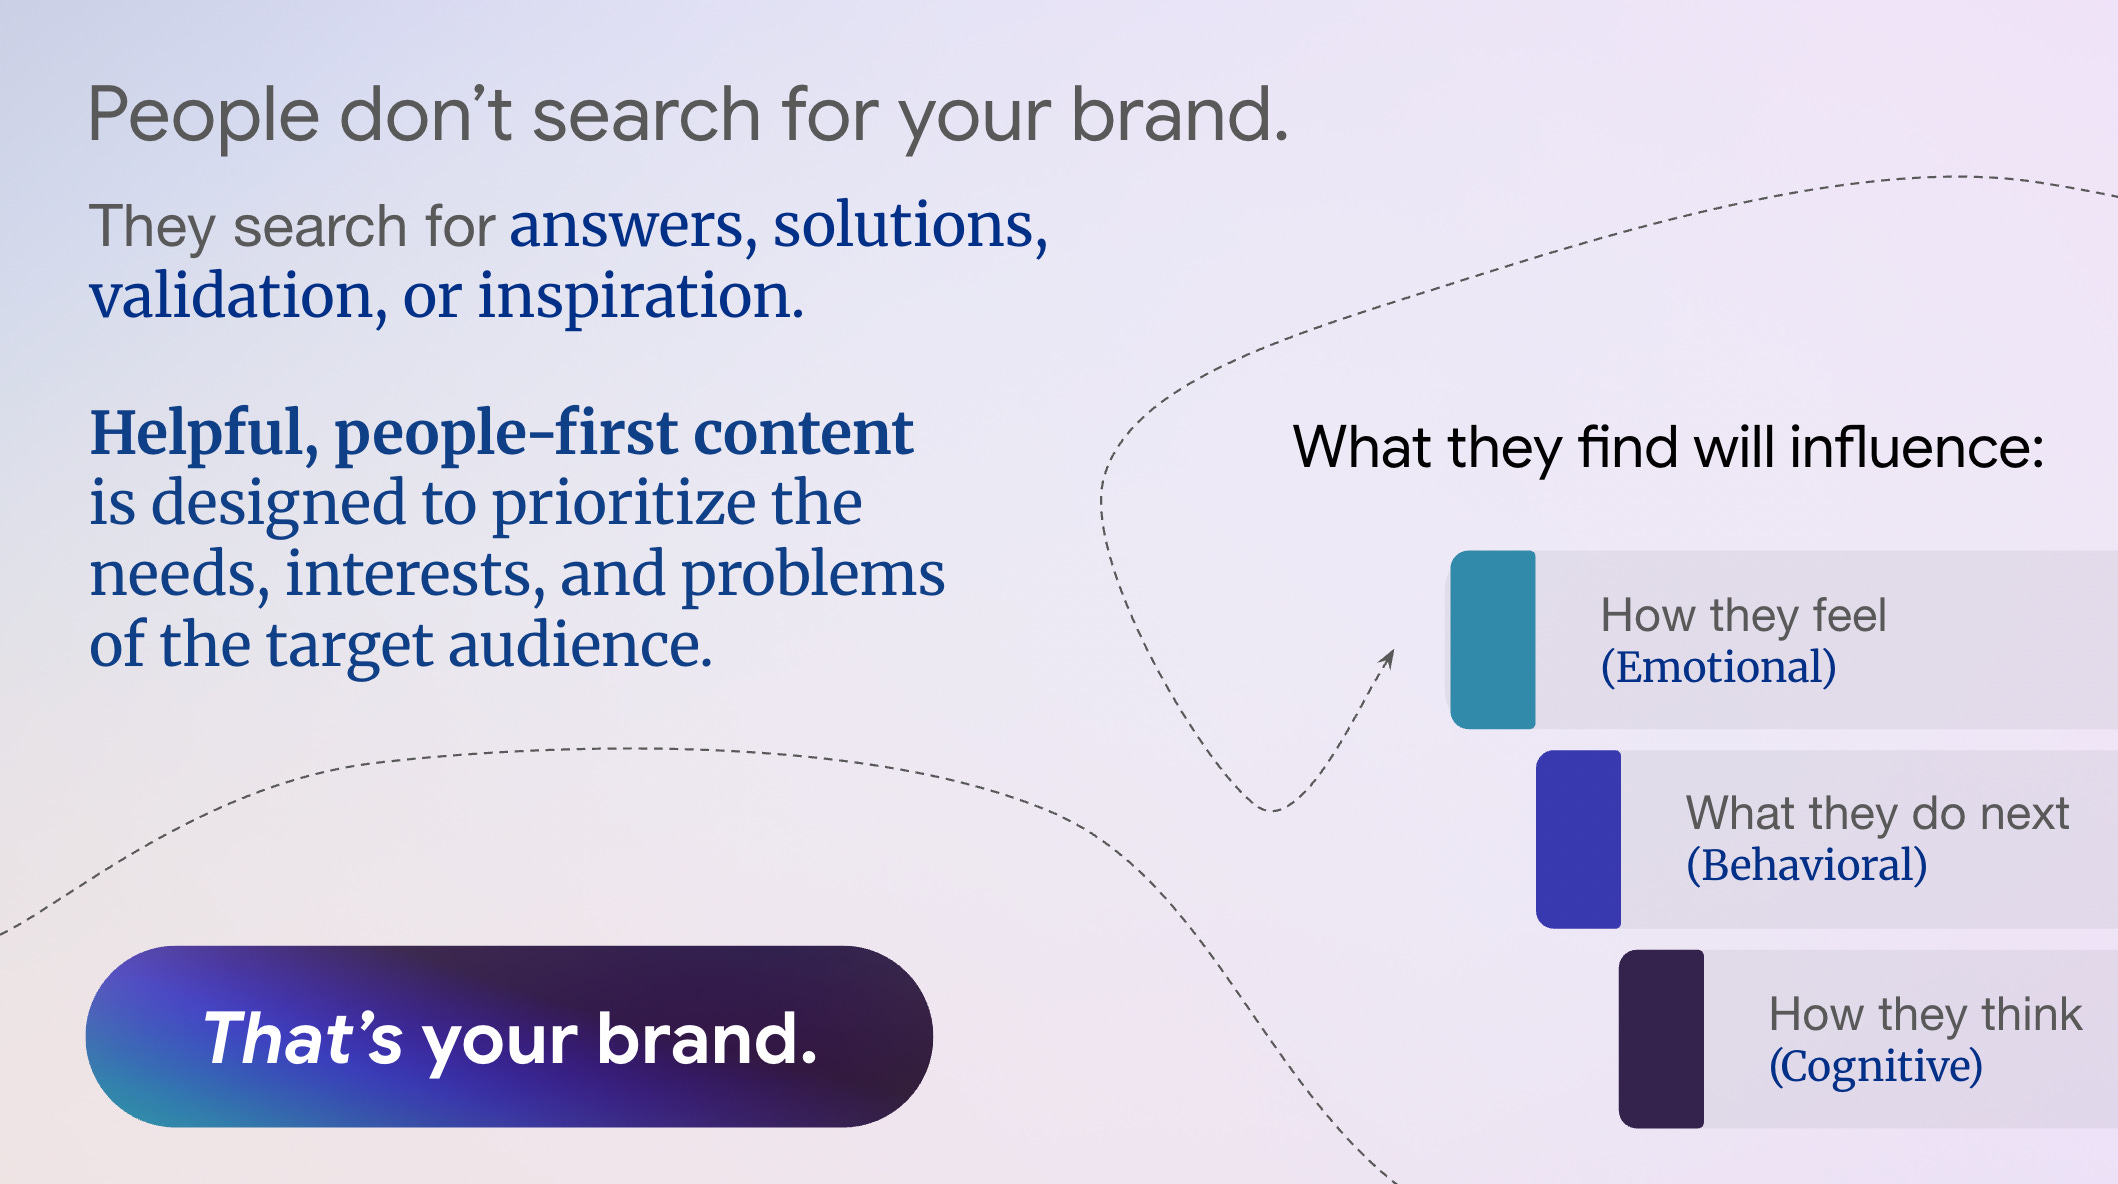
So, maybe your goal is no longer just to rank #1 (links and mentions still matter!), but to be the source material for the AI’s answer.
Also, when users are bombarded with AI synthesized answers, a strong brand becomes a beacon of trust. They will start to search for “[Your Brand Name] vitamin c serum” directly because they trust your expertise.
The questions people ask on Reddit and the products they rave about on TikTok are a wealth of intent data and our informational content must answer these real world queries to capture users wherever they are in their journey.
This context above will frame our entire analysis.
We’re also not going to be looking at Google Search Console data in a vacuum, we’re about to evaluate how well our digital presence is building a trustworthy brand in this “new”, decentralized world.
ALSO, I will say for what it’s worth, the way I approach an analysis task is my own, and it’s very subjective to my experience in business, product and CRO. My SEO experience, while average, is mostly related to brand awareness and perception.
So, of course, each analyst will have their own flavor, or they will build their own flavor with experience.
This is a good time so say thanks to Marco Giordano, who has extensive SEO experience for taking the time to chime in and enrich the SEO approach below even more. Marco writes very good content about digital analytics, SEO and business at Seotistics, make sure you subscribe to his newsletter.
Now, let’s do this 🙂
Table of Contents
Phase 1: The Strategic Framework
Asking the right questions
Step 1: Define Core Business Objectives
Normally, before I even open a dashboard or look at data, my first step is always to frame the analysis around the business’s core objectives. For our eco-friendly skincare brand that sells both one off products and a subscription service I am thinking about 2 things.
- Subscriptions are the key. A customer who subscribes is infinitely more valuable than a one off purchaser. Therefore, any analysis must differentiate between traffic that leads to one off sales versus traffic that leads to subscriptions.
- The “eco-friendly” and “skincare” elements mean customers are highly discerning. They care about ingredients, sourcing, testing, and efficacy. This implies that informational content isn’t only “nice-to-have” but an essential part of the conversion funnel.
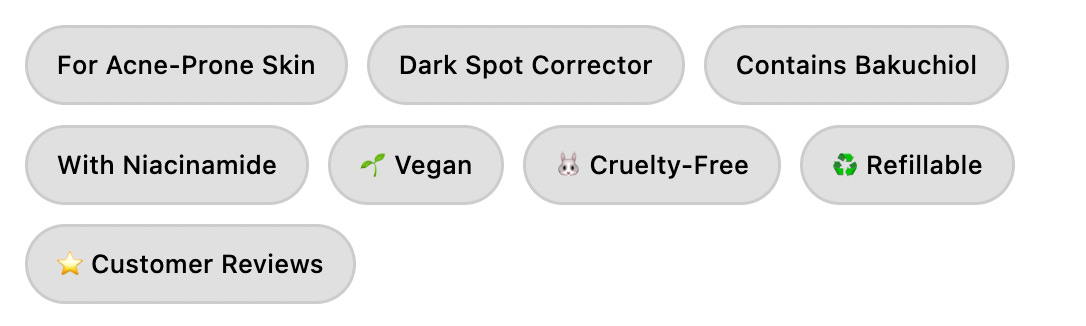
Our potential purchase drivers:
- Problem/Solution: “acne-prone sensitive skin,” “how to reduce dark spots”
- Ingredient-led: “bakuchiol serum,” “niacinamide benefits”
- Value-led: “vegan skincare,” “cruelty-free moisturizer,” “refillable deodorant”
- Brand-led: “[Our Brand Name] reviews”
Step 2: Formulate the Core Business Questions
Based on the business model, we translate our objective into specific, answerable questions.
- Which search terms are driving the most valuable traffic (traffic that leads to subscriptions or high-value first-time purchases)?
- Where are our biggest content gaps? Which high-demand topics (high impressions) are we failing to capture (low clicks/CTR)?
- Does our content effectively bridge the gap between a user’s initial search intent and the desired action (a purchase or subscription)?
- For our most important commercial keywords, what does the SERP look like, and is our content/snippet positioned to win the click?
- How do informational searches contribute to eventual subscription conversions across multiple touchpoints?
Step 3: Define Your Metrics for Success
We need to connect the business model to the data.
Google Search Console Metrics (They represent the demand):
- Impressions: The size of the opportunity
- Clicks: How much of that opportunity we captured
- Click Through Rate (CTR): The efficiency of our SERP presence. A low CTR (CTR=(Clicks/Impressions)×100%) is a red flag
Analytics Tool Metrics (The Behavior):
- Engagement Rate: Are users finding the content relevant enough to interact with? Here, Marco Giordano, recommends: “Use custom formulas for engagement because basic engagement rates can be easily gameable. In the end maybe users view 2 pages, but that might not be exactly the engagement you think.”
- Scroll Depth: Are they reading the content, or bouncing immediately?
- Conversions: This is key. We need to segment this: one_off_purchase, subscription_start
- Conversion Rate per Landing Page: Which pages are our closers? Which pages are chruning traffic?
- User Journey: After landing from search, what is the most common next page? Do they go to a product page, another blog post, or exit?
Success Benchmarks (Post-Implementation):
- CTR improvement targets (non-branded traffic): +2-3% for informational content, +1-2% for commercial pages
- Subscription conversion rate: Target 3-5% for high-intent commercial queries
Phase 2: Data Investigation. Respectfully Holistically, of course 😉

With our strategic questions defined, we now move to the data. Our process must be a systematic hunt for opportunities, combining quantitative data with qualitative data.
Step 1: Intent Classification at Scale
To understand the ‘why’ behind user searches, I need to classify every query by intent. Here’s how I’d approach this:
Ideal Approach
The most scalable approach is to have GSC data flowing into BigQuery. From there, we use Vertex AI to run a classification prompt (using Gemini) directly on our data. The prompt would instruct the model to add a new column, intent_category, based on the text in the query column, sorting it into buckets like “Informational,” “Commercial Investigation,” “Transactional,” etc.
The Practical Reality
If the above isn’t possible, we can export the top 5k-10k queries into a Google Sheet. I’d then use a REGEX formula to categorize intent.
For example:
- Informational: IF(REGEXMATCH(A2, “(?i)what|how|benefits|guide|why”), “Informational”, …)
- Commercial Investigation: IF(REGEXMATCH(A2, “(?i)best|vs|review|alternative|top|comparison”), “Commercial Investigation”, …)
NOTE: I am terrible at REGEX, and if that’s you too, simply use an LLM for it with a prompt along the lines of “Act as a Google Sheets formula expert. Write me a nested IF(REGEXMATCH) formula that categorizes queries in cell A2…”
Step 2: Data Quality Considerations
Now, before going into the analysis, keep this in mind!
- Branded vs. Non-Branded Segmentation.
Create separate analyses. Branded searches (“brand name vitamin C serum”) indicate existing awareness, while non-branded searches (“vitamin C serum sensitive skin”) represent new audience acquisition. - Attribution Windows (optional and if possible)
Set up proper attribution models in analytics tool. A 7-day click, 1-day view window is typically appropriate for skincare purchases, but subscription conversions may need 30-90 day windows. - If you do use the ideal approach with GCP/Vertex AI/Gemini, you need to do a bit of work to make sure that the model is correctly classifying intent. That my friends is precision, recall and the likes.
Step 3: Pattern Discovery
OK, data analysis time. Here are some of the core patterns I would normally look for.
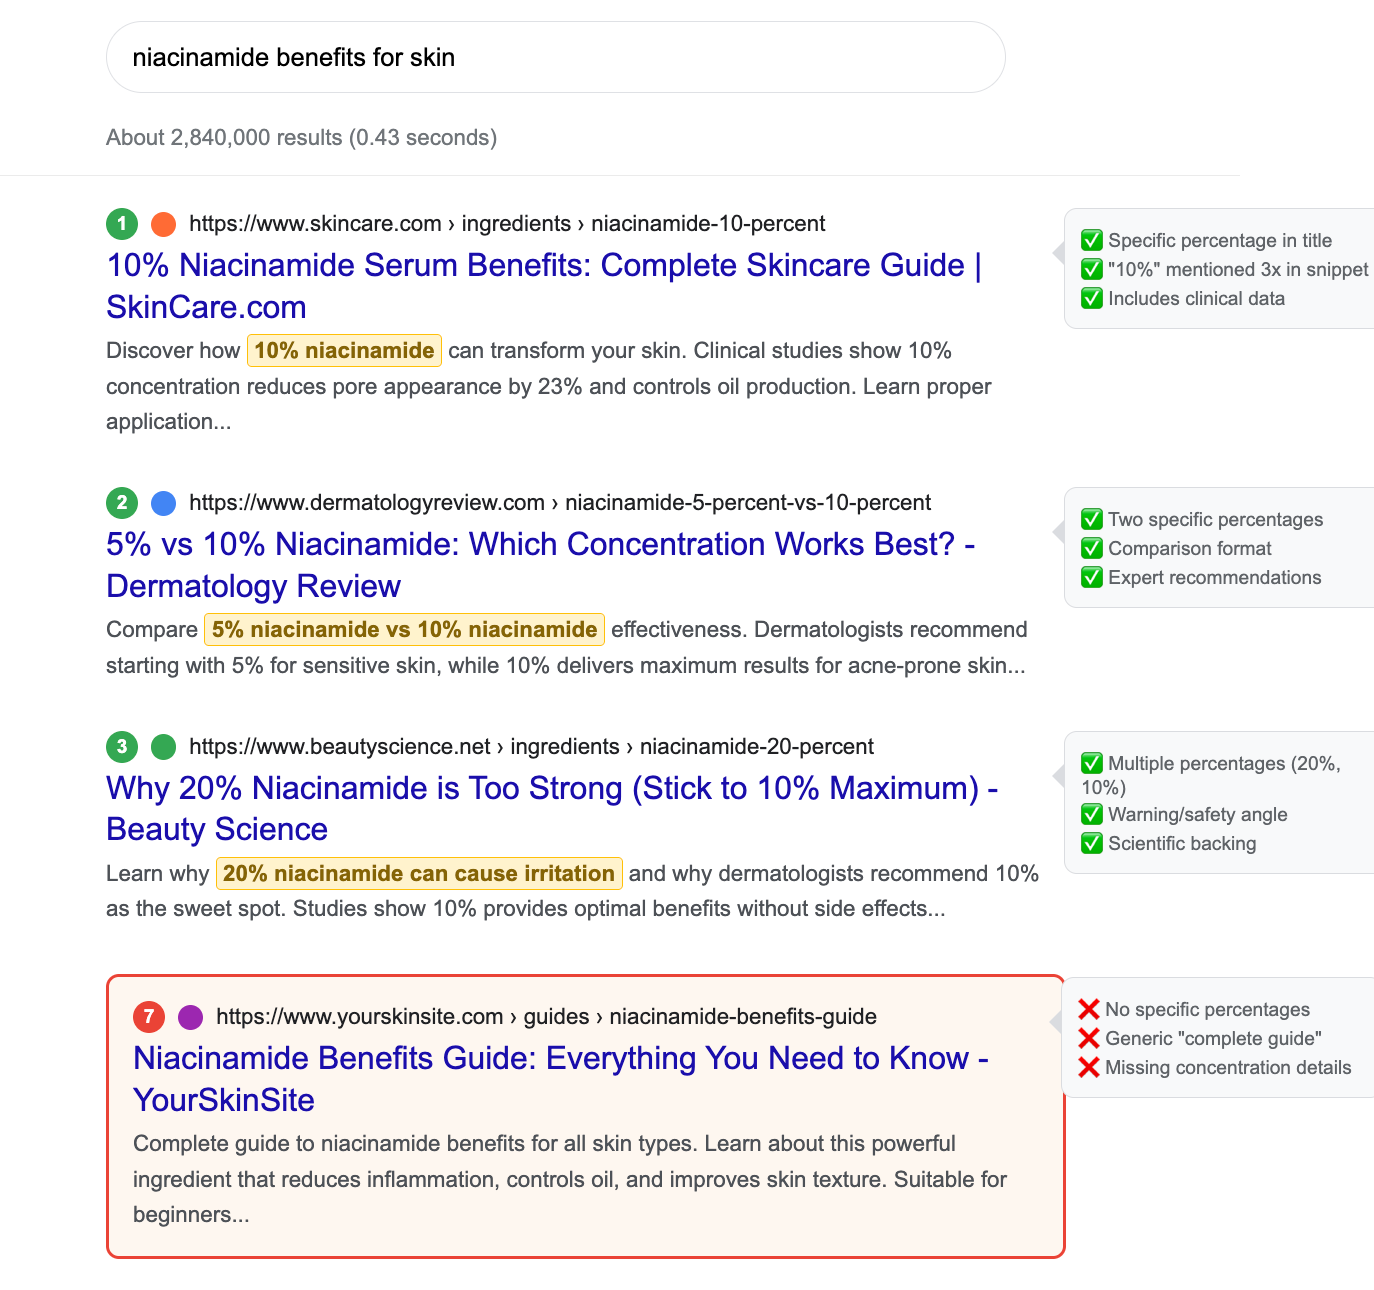
» The high-impression, low-CTR trap
Example: Our “niacinamide benefits” page gets 80K monthly impressions but only 1,200 clicks (1.5% CTR).
- Marco Giordano recommends Pixel Ranking for accurate position tracking, and focusing on SERP features analysis. If there’s a featured snippet we’re not capturing, or if competitors are using more compelling titles, this explains the gap.
- Manual SERP analysis reveals the top 3 results all mention specific percentages (“10% niacinamide”) while our title is generic (“Niacinamide Benefits Guide”). As a CRO inclined person, I love a good manual SERP analysis.
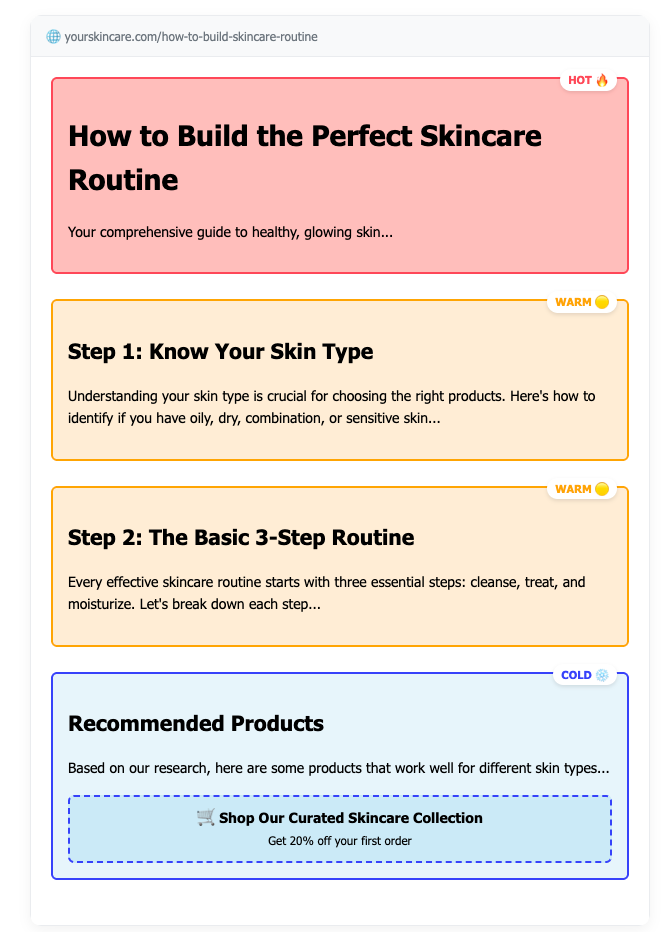
» The conversion funnel leak
Example: Our “how to build a skincare routine” page has great engagement metrics (4-minute average session, 75% scroll depth) but terrible conversion rates (0.1% to any purchase).
- Analyze the user journey. Where do people go after reading? Do they exit, or do they visit product pages but not convert?
- Heat map analysis shows users scroll past our product recommendations. The CTAs are buried and don’t feel like a natural next step.
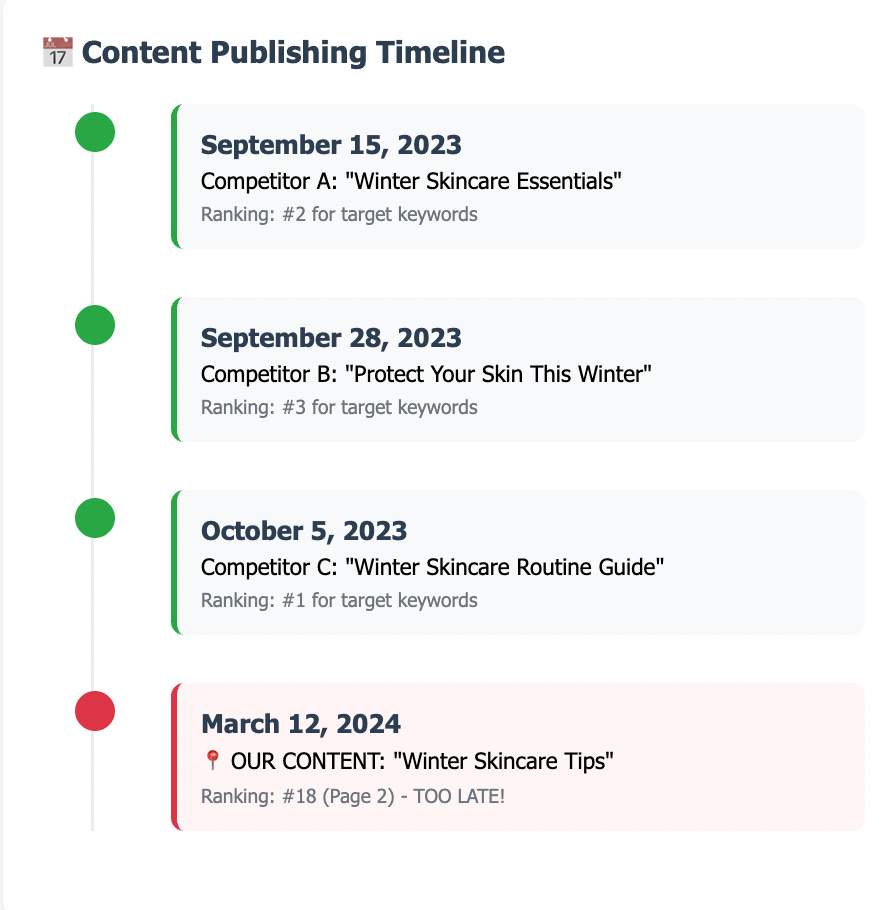
» The seasonal opportunity miss
Example: GSC (Google Search Console) data shows “winter skincare routine” queries spike 300% in October-December, but our related content traffic barely increases.
- Check when our content was published and if it’s optimized for seasonal keywords. Look at competitor content calendars.
- Marco also recommends using Google Trends data and combining it with a heatmap visualization.
- Our “winter skincare” content was published in March and doesn’t appear until page 2 for seasonal queries. Competitors published theirs in September.
Step 4: Competitive Analysis if it fits your story and you have access to some tools or you are collaborating with the SEO team on the project.
- DataForSEO as the GOAT as per Marco🙂
- AlsoAsked.com of PAA analysis and keyword research
(People Also Ask (PAA) is a Google search feature that displays a box of related questions and answers when a user searches for something. These questions are dynamically generated based on the user’s initial query and are intended to provide additional information and help users explore related topics.)I have personally been a very big fan of AlsoAsked for a long time and have been using it in my analysis. - SEMrush/Ahrefs for competitor keyword rankings
- SimilarWeb for traffic estimation but take it with a grain of salt lol
- Screaming Frog for technical SERP analysis (if you have the chops, I don’t really go there in my analysis, and just work with the SEO team on the project)
- Manual SERP checks (incognito, different locations)
How can you approach this analysis?
- Who’s ranking? (Brand vs. affiliate vs. publisher vs. retailer)
- Content angle analysis (Ingredient-focused vs. problem-solving vs. comparison)
- SERP feature capture (Featured snippets, PAA boxes, video carousels)
- Content depth assessment (Word count, comprehensiveness, multimedia usage)
- Technical execution (Schema markup, page speed, mobile optimization) very important from a CRO POV.
Phase 3: (my favorite part)
Observation → Hypothesis → Validation
Now it’s time for checking out for discrepancies and opportunities in the data. I will walk you through multiple real examples based on the business goals we talked about above.
1. The subscription conversion challenge
Goal: Increase Subscription Revenue.
Observation (The ‘What’): We filter our data for landing pages related to our “refillable sunscreen” product. The dashboard shows a pattern:
- GSC Data: The page gets 50K impressions for keywords like “refillable sunscreen” and “zero waste sunblock” (high commercial intent), but the Click Through Rate (CTR) is just 1.5%
- Analytics tool data: Of the traffic that we get, the conversion rate to subscription_start is only 0.5%, while the one_off_purchase conversion rate is 2.5%. Users are choosing the less valuable option
Hypothesis (The ‘Why’): “We are failing to communicate the value and ease of our subscription model both on the Google search results page and on our website.” This is a business problem, not just a data problem.
Validation (The ‘Prove It’): I go beyond the dashboard to confirm my hypothesis.
- SERP Analysis: I search for “refillable sunscreen” in an incognito window. I see our result, but competitors’ results have titles like “Save 20% with a Subscription” or use Price Drop schema. Our title is a generic “Refillable Sunscreen SPF 50 | [Our Brand Name]”. It’s boring and communicates no value.
- UX Walkthrough: Click our own link and experience the page as a user would. The subscription option is buried below the fold, while the one-time purchase button is prominently displayed above the fold.
2: The Content authority gap
Goal: Become the authoritative source for ingredient education. (Marco Giordano is recommending also looking into topical maps for help on this goal)
Observation: Our “retinol guide” content gets 120K impressions monthly but has dropped from position 3 to position 7 over six months, while clicks decreased by 40%.
Hypothesis: “Our content is being outpaced by competitors who are providing more comprehensive, recently updated information that better matches current user intent.”
Validation:
- Content Audit » Our 2000-word guide from 2023 vs. competitor’s 5000-word guide from 2024 with interactive dosage calculator (Marco mentions that most time the year might be the most important denominator)
- User Signal Analysis » Analytics tool shows our average session duration dropped from 4 minutes to 2.5 minutes, indicating decreased engagement
- Search Intent Evolution » People Also Asked boxes now focus on “retinol alternatives” and “retinol for sensitive skin” – topics our content barely covers
Phase 4: Cross Channel Context Integration (OPTIONAL but really great to have!)
Now, yes Google Search Console data is great for analysis but it doesn’t exist in isolation. So here’s how you could contextualize it within broader marketing performance if you are friends with your colleagues from PPC and Social. I normally am, because they are the ones that have so much useful context for my data, and are things that I never think of 🙂
Paid search alignment
- Which organic keywords are you also bidding on? Calculate true cost per acquisition accounting for organic cannibalization.
- Now, word on the digital marketing streets, is that for high-value terms, owning both organic and paid positions increases total click share by 30-50% BUT ALSO, you do not want to train users on paid results. It kinda reminds me of the classic lore “if you improve retention rate by 5% you increase revenue by 25%”, sure, but … it depends.
- High-performing organic pages often indicate high relevance for paid campaigns
Social & Community data
- Reddit/Discord Mining: You could test tools like Gummy Search to find real user questions that inform both your content strategy and paid social targeting
- TikTok Trend Analysis: Hashtag performance and sound trends can (sorta) predict search volume spikes 2-4 weeks in advance
- Social Proof Integration: User generated content from social can be repurposed to improve SERP snippets and CTR
Bonus: Social listening! if your client/company uses Brandwatch, Youscan, or other social listening tools, get your hands dirty in there, there is of course a lot of noise, but also some gold can be found if you know specifically what you’re looking for.
MAYBE also email and retention context ?
- How much of your email list growth comes from organic search traffic vs. other channels?
- Do subscribers who came via informational searches have different engagement patterns than those from commercial searches?
Phase 5: (finally)
Narrative Construction
Of course, an insight is useless until it’s communicated effectively. We now must build a presentation deck designed to persuade stakeholders and drive action.
Here’s the almost complete framework I would use.
Full Deck / Presentation Structure
» Slide 1
Summary of Findings (or Executive Overview Urchin.js style (LOL) – who knows, knows)
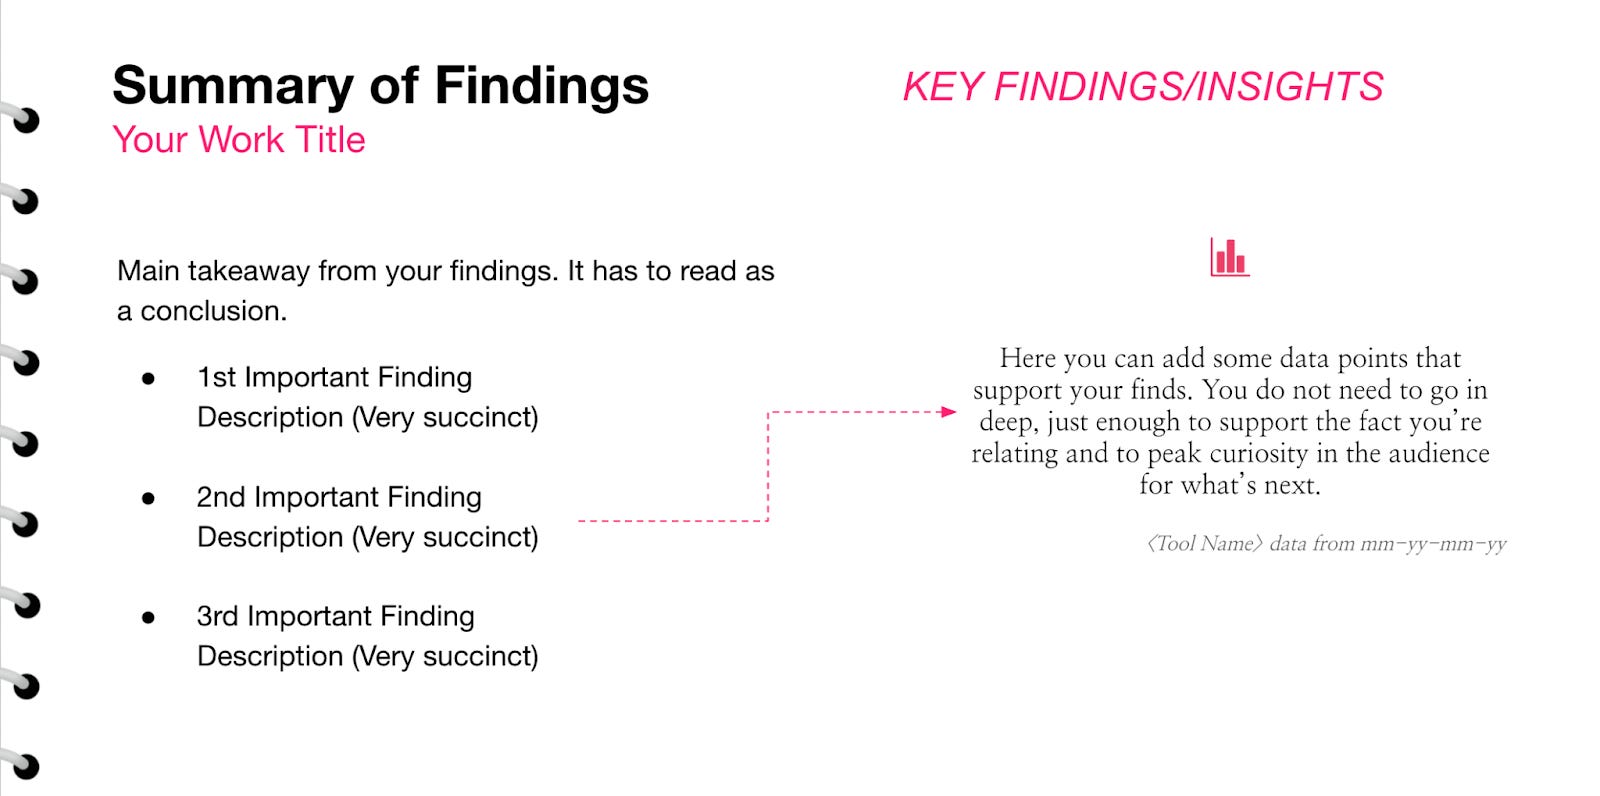
» Slides 2-3
Strategic Context
- Current task at hand landscape (in our case search, cro + AI Mode, decentralized discovery)
- Business model implications always
- Maybe competitive positioning if you found anything juicy 🙂
Here I always like to use some industry stats and benchmarks and paint a story.
» Slides 4-8
Core Insights (1-2 slides each)
- Quantitative evidence (numbers from your analytics tool or GSC)
- Qualitative validation (screenshots of SERPs, on page experience, you vs competitors in SERP or UX)
- Business impact calculation (if possible)
- Specific recommendations for each insight – what is the ask?
ALWAYS PUT ONLY ONE INSIGHT PER SLIDE!!!!
» Slides 9-10
Implementation Roadmap (we will cover this broadly below)
- Prioritization framework
- Resource allocation
- Success metrics
- Timeline with milestones
» Slide 11
Risk Assessment – NICE TO HAVE! but not always possible.
- What could go wrong
- Mitigation strategies
- Plan B scenarios
Now, let’s go into a more detailed insight presentation, using the sunscreen example from above.
» Slide Title
Insight #1 – Our Disconnected Journey is Costing Us High-Value Subscribers
» Quantitative Evidence (The ‘What’)
“Our data shows a two-part problem for our Refillable Sunscreen, our key subscription driver:”
Acquisition Failure (GSC Data): “We’re leaving 98.5% of potential clicks on the table. Despite 50K monthly impressions for valuable terms, our 1.5% CTR is significantly below the 4-6% benchmark for commercial intent queries.”
Persuasion Failure (Analytics Tool Data): “Of the users we do acquire, we are failing to convert them effectively. The conversion rate to a high CLV subscription is 0.5%, while 5 times as many users (2.5%) opt for a low CLV single purchase.”
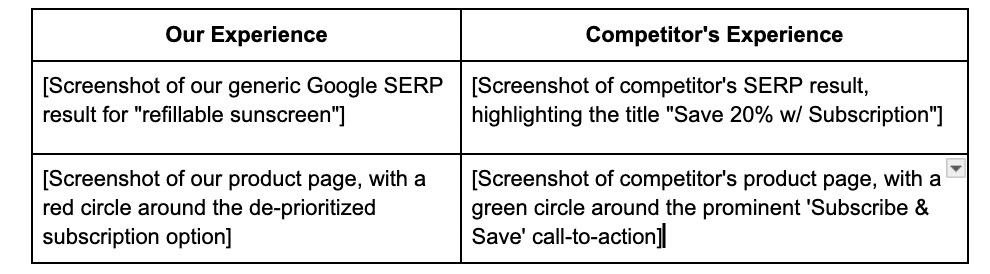
» Qualitative Evidence (The ‘Why’) using visuals from our validation step:
“This is an experience problem. Here’s a side-by-side of the user journey:”
» Business Impact Calculation
“If we improved our CTR to industry benchmark (4%) and subscription conversion to 2%, we would generate an additional 750 new subscribers monthly (50000 × 0.025 × 0.02 = 25 vs current 3.75). At $35 monthly subscription value and 12-month average retention, that’s $315K in additional annual recurring revenue from this single product page.”
» Specific Recommendations:
- SERP Optimization (2 weeks): Update title tag to “Refillable Sunscreen SPF 50 – Save 25% with Subscription | [Brand]”
- Landing Page Redesign (4 weeks): Move subscription option above the fold with clear value proposition – hello experiments 😀
- A/B Testing (6 weeks): Test different subscription incentives and CTA placements
» Success Metrics:
- CTR improvement: Target 3.5% within 8 weeks
- Subscription conversion rate: Target 1.5% within 12 weeks
- Revenue impact: Track monthly new subscriber cohorts
Phase 6: Implementation and Measurement Framework
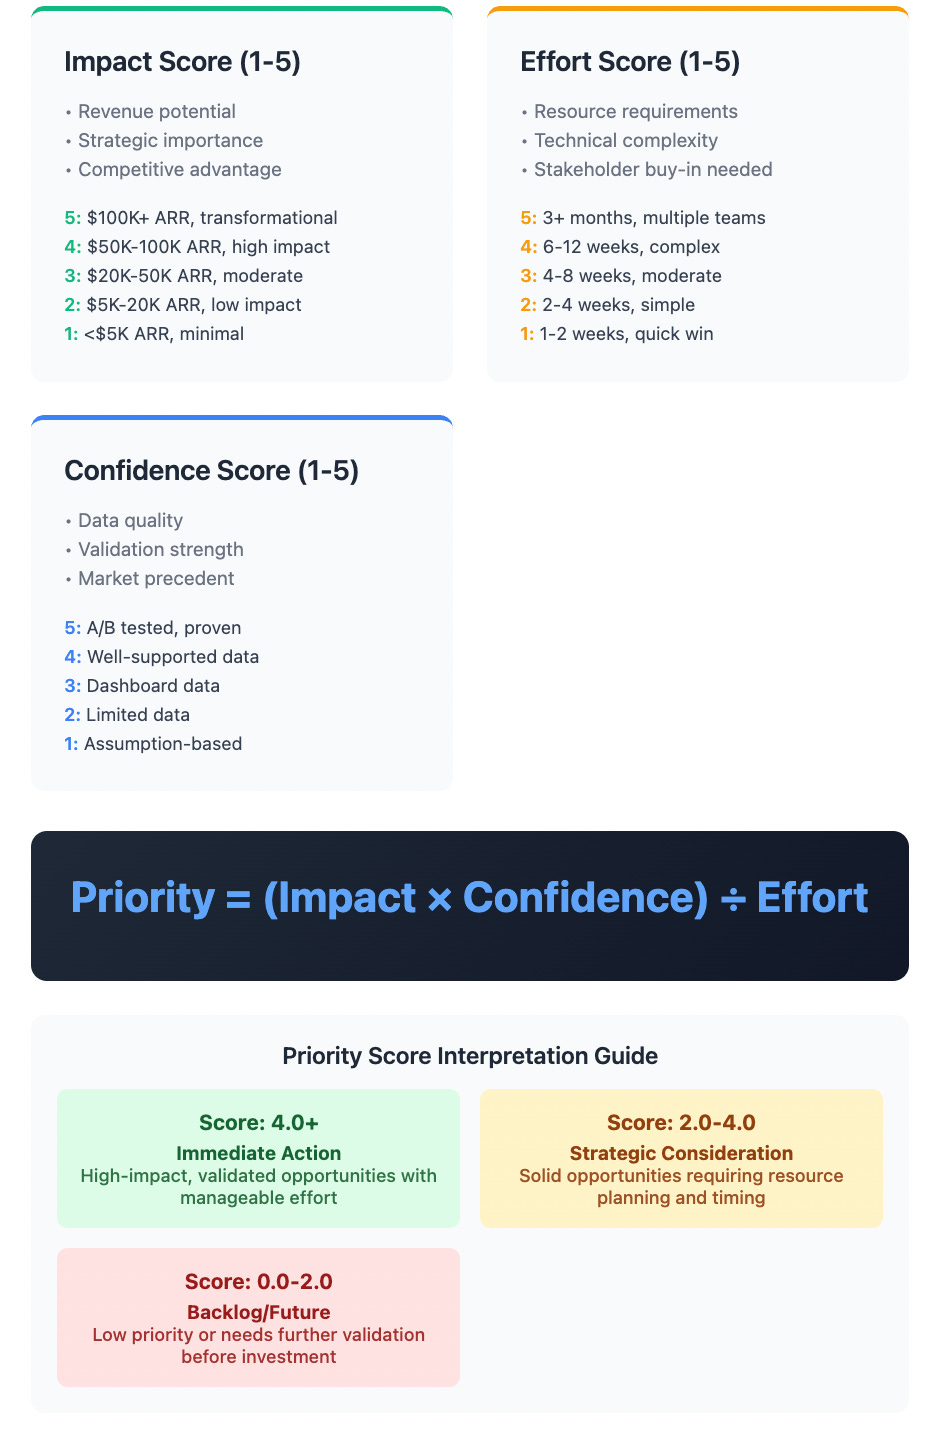
Prioritization Matrix
When you identify multiple opportunities, use this framework or ANY framework.
Resource Allocation
For example for content initiatives consider adding:
- Copywriter: X hours for descriptions, titles, page copy
- Designer: X hours for CTA optimization, layout changes, menus, navigation,etc.
- Developer: X hours for technical implementation
- Digital Analytist: x hours for tracking correction/new measurement planning
- CRO/SEO Specialist: X hours for A/B Testing & ongoing optimization
And you also will need to add a timeline. I normally am very lucky to work with great project managers that will cover this part (Thanks Chloe and Matt :D), but it’s also important for you, as an analyst, to have this in mind when you propose anything back to the business. A general timeline can be something like:
- Week 1-2: Implementation
- Week 3-4: Initial data collection
- Week 5-8: Optimization based on early results
- Week 9-12: Full performance evaluation
!!! Common Pitfalls to Avoid !!!

Now, nothing in life is without error, assumptions and good intentions. So here are some specific pitfalls for a project like this. Also, pitfalls will exist for any data analysis task. And in general most of them will have to do with the data quality, business context, tool limitations, data limitations and well, with being human, and not knowing EVERYTHING. And that is totally fine. I too do not have all the answers 😉
But for the sake of this example, here is what can go wrong for my use case.
- Judging informational content purely on last-click conversions. Always analyze first-touch attribution and assisted conversions. (Content also can be used to simply build awareness and that is totally fine!)
- Not considering the full SERP context (featured snippets, PAA boxes, ads). Screenshot and analyze the entire SERP, not just your position in it.
- Making strategy decisions based on single month data snapshots. Always analyze 12+ months of data to identify seasonal patterns. You can start with a month analysis, find the main things that are going on, and then go back in time and analyze a full year, then make decisions.
- Recommending content changes without considering page speed, mobile experience, or schema markup. Run technical audits alongside content analysis! If your task is only related to content analysis, make sure you recommend your stakeholders or your teams to do technical audits too.
- Analyzing static competitor data without monitoring their changes over time. Recommend setting up automated competitor tracking for key pages and keywords if possible.
OK, this is the final sanity checklist!
Before presenting your work back to the business, run through this checklist one more time to make sure you covered everything.
» Strategic Framing
- Is the analysis grounded in the current reality of your task? (in our case here, it was AI Mode, decentralized discovery, search, cro, experience)
- Is it explicitly tied to the company’s top level business goals (MRR, CLV, Market Share)?
- Have I considered cross channel implications and attribution complexity? (if the case needs it)
- Are my recommendations aligned with available resources and capabilities?
» Investigation & Validation
- Have I blended my demand data from the search console with behavioral data from my analytics tool? (in your case might be your CRM + Analytics tool)
- For each key insight, have I gone beyond the dashboard to validate my hypothesis by walking through the entire user journey? VERY IMPORTANT.
- Have I checked for a message match between the promise on the SERP and the experience on the landing page?
- Have I considered seasonal patterns and data quality issues?
- Is my competitive analysis comprehensive and current?
» Narrative & Presentation
- Does my executive summary deliver the core conclusion and recommendations upfront?
- Have I quantified the opportunity in terms that matter to the business (revenue, CLV)?
- Is my story supported by clear, comparative visual evidence (screenshots, data visualizations)?
- Are my recommendations specific, actionable, and assigned to an owner with clear success metrics?
- Have I included a realistic timeline and resource allocation plan?
- Have I addressed potential risks and mitigation strategies?
» Implementation Readiness
- Are my priorities ranked using a clear, defensible framework?
- Do I have specific success metrics and measurement plans for each recommendation?
- Have I considered the technical feasibility of my recommendations?
- Are there quick wins that can build momentum while larger initiatives develop?
Last thoughts!
In the end, my way of doing this is just one way to approach an analysis task.
You will always have different contexts, situations, stakeholders, and caveats to work with. A B2B SaaS company will have different conversion funnels than our skincare brand. A media publisher will care more about engagement metrics than subscription rates. A local service business might prioritize phone calls over online conversions.
But I hope I was able to help you look at your analysis task more from a business perspective. This framework I use doesn’t require you to memorize it or to be followed like gospel. Even I adapt it all the time.
It’s more of a mindset. I ask “So what?” after every data point and “What now?” after every insight. I like to be curious, I like to step outside my job description and try to dabble into SEO, PPC, and other areas that I might not be an expert in, but with the right mindset and approach towards the people you work with, you can “collect context” enough to make your analysis meaningful to the business. Plus you get to learn tons from them 🙂
In the end, our role isn’t to impress people with our technical skills or overwhelm them with charts. Our role is to be the bridge between what the data is telling us and what the business needs to hear to make progress.
We are the translator who turns numbers into narrative, patterns into priorities, and insights into action. As Nicola Strand said Friday in my class, “The data is just…the data”, what you do with it, the stories you tell, the narratives you build, fully immersed in the business, will be what drives decisions.